SGE Click Through Rate: How Google’s Search Generative Experience is Transforming CTR Metrics
Your organic search results just got pushed down 1,243 pixels, and most business owners don’t even know it happened. Google’s Search Generative Experience now appears in over 91% of searches, fundamentally reshaping how users interact with search engine results pages and creating an entirely new click through rate landscape that demands immediate attention.
Key Takeaways
- SGE appears in 91.4% of searches as of 2024, significantly impacting traditional click-through rates
- Organic results drop approximately 1,243 pixels when SGE triggers, reducing visibility and CTR
- SGE CTR varies dramatically by industry vertical - finance shows 47% coverage while beauty reaches 94%
- Fewer sources in SGE results (3-5 average) can increase individual source CTR but reduce overall optimization opportunities
- Zero-source SGE results appear in 5% of queries, capturing traffic without providing external links
What is SGE Click Through Rate?
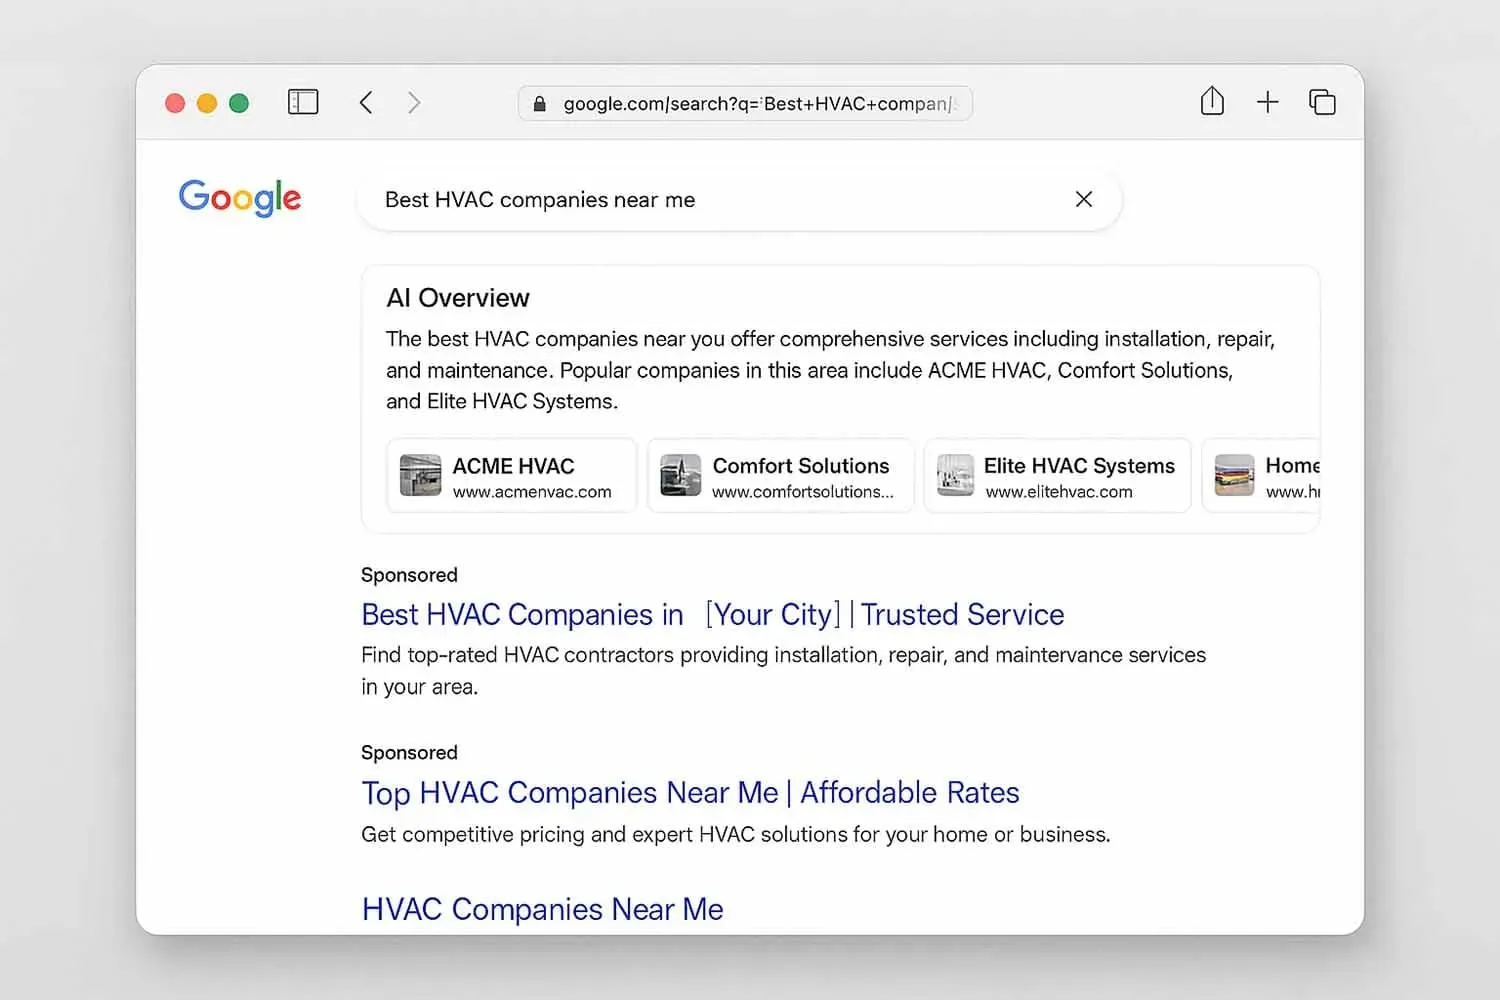
SGE click through rate measures the percentage of users who click on sources within Google’s Search Generative Experience results rather than traditional organic listings. Unlike conventional click through rates that track engagement with standard blue links, SGE CTR focuses specifically on how users engage with AI-generated content and the curated sources within those generative results.
This metric has become critical for SEO professionals since Google’s broader SGE rollout in May 2024. When search generative experience SGE triggers, it fundamentally alters user behavior on the search results page. Instead of scanning through multiple organic search results, users now encounter comprehensive answers synthesized by generative AI before seeing traditional listings.
The relationship between SGE visibility and traditional search performance metrics creates a new optimization paradigm. A dental practice might rank #1 organically for “emergency tooth pain relief,” but if SGE provides a complete answer with competitor citations, that top ranking loses significant value. The search landscape now demands understanding both traditional ranking factors and SGE source attribution mechanics.
Google SGE uses large language models to analyze user queries and generate contextually relevant responses. These AI generated summaries pull information from multiple sources, often presenting 3-5 cited websites within the generative experience. For local service businesses, this means competing not just for organic rankings, but for inclusion in SGE’s curated source list.
Current SGE Click Through Rate Data and Trends
Recent analysis of 2,900 keywords reveals SGE results now appear in 91.4% of searches, representing a significant increase from 86.8% in previous studies. This expansion affects virtually every industry vertical, with 84% of SGE responses covering more than half the screen real estate on both mobile devices and desktop interfaces.
The finance vertical shows particularly dramatic growth, with SGE coverage increasing from just 22% in July 2023 to 47% in April 2024. This represents more than doubling of generative content presence for financial service queries. Meanwhile, ecommerce brands face even steeper challenges, with retail verticals experiencing 1,500-pixel drops in organic positioning when SGE appears.

Health queries demonstrate 80% SGE coverage despite Your Money or Your Life (YMYL) restrictions that traditionally limited AI generated content in medical contexts. This suggests Google’s confidence in its machine learning algorithms for synthesizing health information, though external websites maintaining E-E-A-T signals still dominate source citations.
Key metrics reveal the scale of this transformation:
- Screen coverage: 84% of SGE results occupy more than half the visible search results page
- Source attribution: Average 3-5 sources per SGE result across industries
- Zero-click queries: 5% of searches provide SGE answers without external source links
- Mobile impact: SGE responses average 1,200+ pixels on mobile screens
The data shows users research differently when SGE triggers. Traditional click through rates for organic results below SGE can drop 30-60%, but quality of traffic often improves as users arrive more informed about their specific needs.
Industry-Specific SGE CTR Performance
Beauty and cosmetics businesses lead SGE appearance rates at 94%, making this vertical highly competitive for source attribution within generative results. HVAC contractors and roofing companies typically see SGE coverage around 70-80% for service-related queries, while legal services experience variable coverage depending on practice area complexity.
Finance and investing queries show lower 47% SGE coverage but create concentrated competition among fewer sources. When SGE does trigger for financial queries, the average source count drops to 3 citations, increasing individual click through rates for featured firms but limiting overall optimization opportunities.
Hotels and entertainment businesses face unique challenges with SGE implementation. These verticals may experience up to 40% fewer clicks due to limited source counts in travel-related generative content. However, Google Maps integration within SGE results creates new visibility opportunities for location-based businesses.
Industry SGE Coverage Breakdown:
- Beauty/Cosmetics: 94% coverage
- Health/Medical: 80% coverage
- Finance/Legal: 47% coverage
- Home Services: 75% coverage
- Retail/eCommerce: 85+ coverage
Ecommerce businesses confront significant CTR challenges as SGE adoption expands into product searches. Shopping ads continue displaying alongside generative content, but organic product listings face increased competition from AI generated product comparisons and feature summaries.
YMYL categories demonstrate variable SGE coverage based on E-E-A-T factors. A personal injury attorney with robust structured data and authoritative content might achieve SGE source inclusion, while newer legal practices struggle to gain AI-powered visibility without established topical expertise signals.
How SGE Affects Traditional Click-Through Rates
The average 1,243-pixel drop in organic result positioning when SGE triggers fundamentally reshapes user interaction patterns with search engine results pages. Users increasingly find complete answers directly within generative content, reducing their need to click through to external websites for basic information.
This shift creates both challenges and opportunities for local service businesses. A plumbing company’s comprehensive service page might see reduced direct traffic, but when featured as an SGE source, the business gains enhanced credibility and authority positioning. The quality of resulting leads often improves as prospects arrive already educated about services and pricing.
Featured snippets and rich results gain amplified importance for maintaining visibility above SGE content. These elements can appear alongside generative results, providing additional click opportunities for well-optimized content. Schema markup becomes crucial for helping search engines understand and potentially feature business information within AI generated summaries.
Auto-generated versus manual SGE triggers create different user engagement patterns. Health verticals show 68% auto-generated SGE views with only 9% requiring user action to expand generative content. This immediate visibility impacts organic traffic substantially, as users encounter comprehensive answers before seeing traditional search results.
Auto-Generated vs. Manual SGE Triggers
Hotels and entertainment queries show opposite trends, with more manual triggers requiring users to click “Generate” for SGE content. This behavior suggests query complexity and user intent influence SGE activation patterns. Travel-related searches often require nuanced, personalized responses that benefit from user-initiated generative content.
Tracking these ratios helps prioritize SGE optimization efforts by vertical. A dental practice serving emergency patients benefits more from auto-generated SGE optimization, while specialized legal services might focus on traditional organic rankings if manual triggers dominate their query space.
The distinction affects measurement strategies as well. Auto-generated results impact organic traffic immediately and measurably, while manual triggers require different tracking approaches to understand user engagement with generative content options.
Understanding trigger patterns enables more precise SEO strategies. Businesses can optimize content specifically for auto-generating SGE queries while maintaining traditional optimization for manual-trigger search terms.
SGE Source Attribution and CTR Distribution
Google’s Search Generative Experience typically features 3-5 sources per result, with significant variation across industry verticals. Finance and hotel businesses average closer to 3 sources, creating higher individual click through rates but limiting opportunities for multiple business citations within single generative results.
The 5% of queries showing zero-source SGE results represent a growing concern for online businesses. These responses provide complete answers without external attribution, effectively capturing user attention without driving traffic to any websites. Monitoring zero-source query patterns helps identify content gaps and optimization opportunities.
Horizontal scrolling within SGE results affects source visibility and click distribution significantly. Sources appearing in top-left positions achieve markedly higher click through rates and impression rates compared to those requiring horizontal scrolling to view. This positioning advantage parallels traditional search results hierarchy but operates within the constrained SGE interface.
SGE Source Distribution Patterns:
- Finance/Legal: Average 3 sources per result
- Health/Medical: Average 4 sources per result
- Home Services: Average 4-5 sources per result
- Retail/eCommerce: Average 5+ sources per result
The concentration of sources creates intense competition for inclusion. A roofing contractor competing against 4 other sources within SGE has higher individual click probability than competing against 20+ organic listings, but achieving SGE inclusion requires exceptional content quality and technical optimization.
Source attribution within SGE results often favors websites with comprehensive structured data implementation and strong E-E-A-T signals. Local service businesses must optimize specifically for AI understanding, not just traditional search engine crawlers.
Optimizing for Better SGE Click Through Rates
Successful SGE optimization requires focusing intensively on E-E-A-T signals that demonstrate expertise, experience, authoritativeness, and trustworthiness to Google’s generative AI systems. Local service businesses must create content that directly answers user queries with clear, concise information formatted for machine learning comprehension.
Implementing comprehensive structured data becomes non-negotiable for SGE visibility. Schema markup helps AI language models understand business services, pricing, availability, and customer reviews. A dental practice with detailed structured data for procedures, staff credentials, and patient testimonials significantly improves chances of SGE source inclusion.
Content optimization for conversational search and long tail keywords aligns with how users phrase queries for generative results. Instead of targeting “HVAC repair,” optimize for “what causes my air conditioner to freeze up in summer” and similar natural language search queries that trigger SGE responses.
Essential SGE Optimization Elements:
- Comprehensive schema markup for services, reviews, and business information
- FAQ-style content addressing specific user questions
- Multimedia content integration (images, videos) for multi-modal SGE features
- Mobile-optimized, fast-loading pages for improved AI crawling
- Regular content updates demonstrating current expertise
Creating content with multimedia elements enhances opportunities for inclusion in SGE’s expanding multi-modal features. A roofing company with before-and-after photo galleries, procedure videos, and detailed material explanations provides rich content for AI synthesis and user engagement.
Technical SEO for SGE CTR
Site speed optimization becomes critical as search engines evaluate content for AI-powered results generation. Pages loading faster than 2.5 seconds receive preferential treatment in SGE source selection algorithms. Technical SEO audits should prioritize Core Web Vitals metrics that influence both traditional rankings and generative content inclusion.
Ensuring proper crawlability and indexability enables AI systems to understand and synthesize content effectively. Clean URL structures, logical internal linking, and comprehensive XML sitemaps facilitate both traditional search engine crawling and AI content analysis for generative results.
Google Search Console provides limited but valuable insights for tracking SGE-related performance metrics. Monitor impression changes, click patterns, and query performance to identify when SGE implementation affects specific keyword rankings and traffic patterns.
A/B testing different content formats and structured data implementations reveals what resonates with both users and AI systems. Test FAQ sections, detailed service descriptions, and various schema markup approaches to optimize for SGE source attribution.
Measuring and Tracking SGE CTR Performance
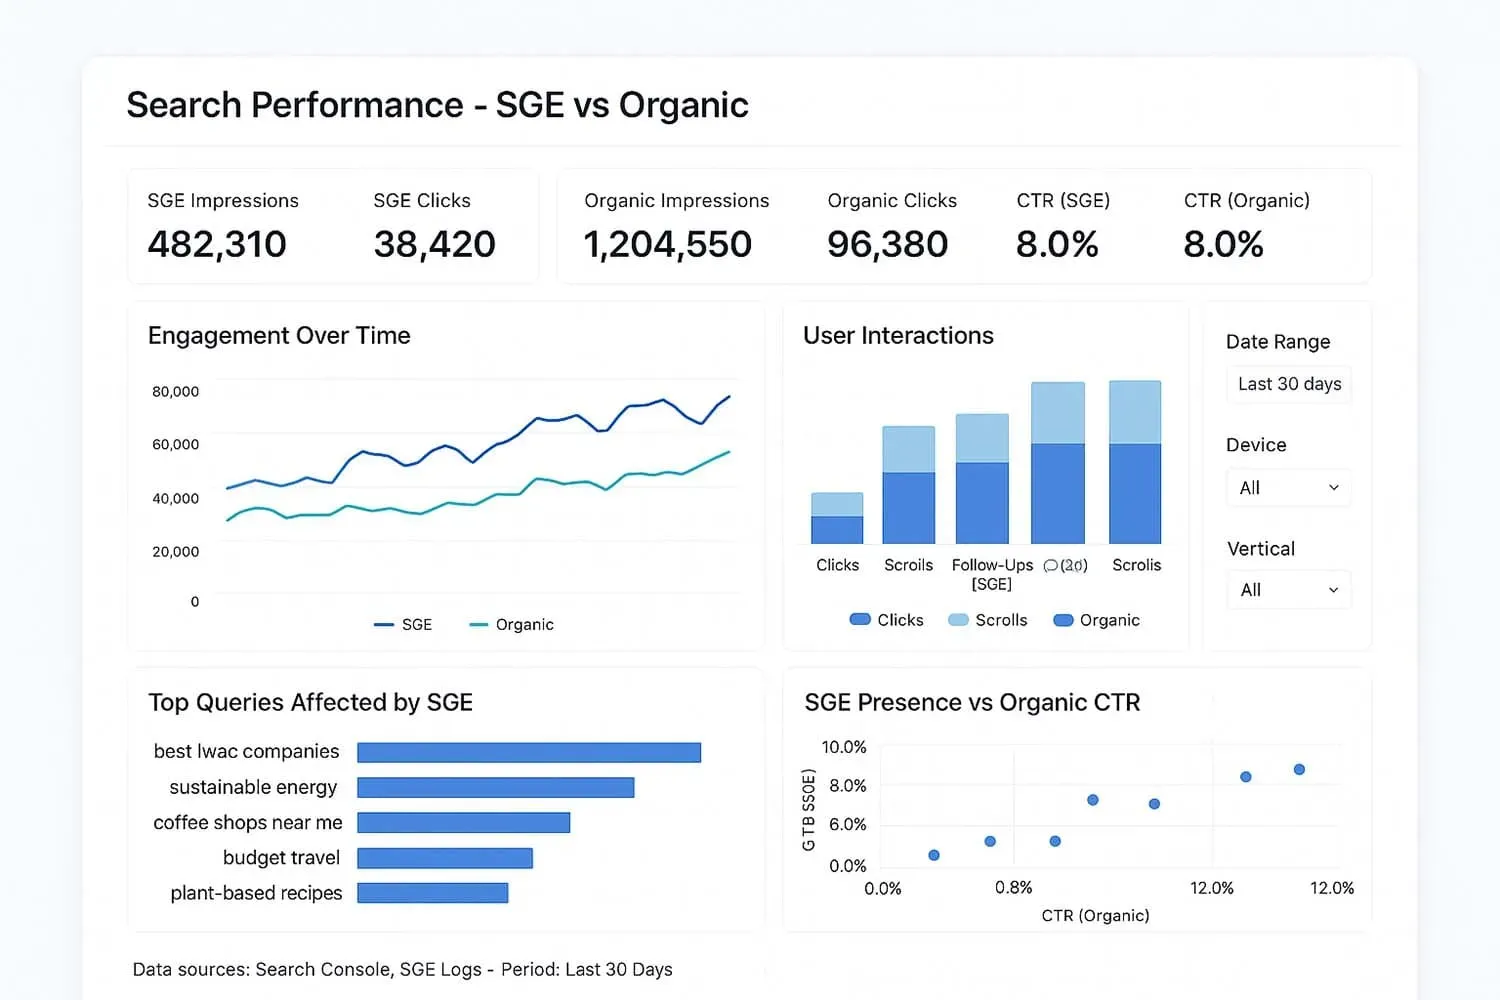
Monitoring SGE impact requires tracking metrics beyond traditional click through rate measurements. Key performance indicators include SGE impressions, source attribution frequency, and changes in traffic quality rather than just quantity. These metrics provide clearer pictures of generative search impact on business performance.
Google Analytics 4 enables tracking user behavior changes when SGE affects search results. Set up custom events to monitor how users interact with your site after arriving from SGE sources versus traditional organic listings. This data reveals whether SGE traffic converts differently than conventional search traffic.
Critical SGE Tracking Metrics:
- SGE impression frequency for target keywords
- Source attribution rate within generative results
- Click through rate changes over time
- Traffic quality metrics (bounce rate, session duration)
- Conversion rate differences between SGE and organic traffic
Industry-specific benchmarking provides context for SGE CTR performance evaluation. A legal practice should compare SGE source inclusion rates against other law firms, while HVAC contractors benchmark against home service industry averages rather than universal metrics.
The GOA (Generative to Organic Alignment) and OGA (Organic to Generative Alignment) scoring methods help quantify how well traditional SEO strategies translate to SGE optimization success. These frameworks guide strategic decisions about resource allocation between conventional and generative search optimization.
Regular monitoring reveals trends as Google refines SGE algorithms and expands coverage across query types. Weekly performance reviews help identify sudden changes in SGE visibility and enable rapid optimization adjustments to maintain competitive positioning.
Future of SGE Click Through Rates
Google continues expanding SGE coverage across more query types, with industry experts predicting near-universal adoption within 18-24 months. This expansion will fundamentally reshape search engine optimization strategies and require businesses to prioritize generative content optimization alongside traditional SEO approaches.
New ad formats integrated within SGE results present both opportunities and challenges for paid advertising strategies. Google Ads may eventually include native placements within generative content, creating premium positioning options for businesses willing to invest in SGE-specific advertising approaches.
User behavior evolution as SGE becomes the standard search experience suggests reduced click through rates for traditional organic results but potentially higher-quality traffic for businesses achieving SGE source attribution. Users arriving from generative results often demonstrate stronger purchase intent and better-qualified needs.
Predicted SGE Evolution Trends:
- Integration with Google Merchant Center for enhanced product information
- Voice search optimization becoming crucial for conversational AI queries
- Local search features expanding within SGE results
- Industry-specific generative templates for service businesses
The importance of staying adaptable as Google refines SGE algorithms cannot be overstated. Early adopters of SGE optimization strategies will capture disproportionate advantages as competitors struggle to understand generative search requirements.
Integration with other Google products and services will affect click through rate patterns significantly. Google Maps integration within SGE creates new visibility opportunities for location-based businesses, while YouTube content integration may influence video optimization strategies for local service providers.
Machine learning advances will continue improving SGE accuracy and relevance, making source attribution even more competitive. Businesses must invest in comprehensive content strategies that demonstrate clear expertise and authority within their service areas to maintain SGE visibility as competition intensifies.
FAQ
What is a good SGE click through rate compared to traditional organic CTR?
SGE click through rates typically range from 8-15% for featured sources, which can be higher than traditional organic position #3-5 CTRs but lower than top organic positions. However, SGE traffic often shows better conversion rates due to more qualified user intent, making overall ROI comparable or superior despite potentially lower click volumes.
How do I know if my site is appearing in SGE results?
Monitor your target keywords using incognito searches and check for your business appearing in the source citations within SGE responses. Google Search Console may show impression changes when SGE triggers, though direct SGE attribution tracking remains limited. Third-party SEO tools are developing SGE monitoring capabilities to provide clearer visibility.
Does SGE CTR count toward traditional search performance metrics?
SGE clicks are typically tracked separately from traditional organic clicks in analytics platforms. While they may appear in Google Search Console impression data, the attribution and tracking mechanisms differ from standard organic result interactions. Businesses should monitor both metrics independently for comprehensive performance analysis.
Which industries see the highest SGE click through rates?
Beauty and cosmetics (94% SGE coverage), health and medical (80%), and retail/ecommerce (85%+) show the highest SGE appearance rates. However, industries with fewer sources per SGE result, like finance and legal (averaging 3 sources), may see higher individual click through rates when featured due to reduced competition within the generative interface.
Jeremy Johnson
Owner
Jeremy co-owns Robben Media and directs strategy for every client engagement. With a Computer Engineering degree from Missouri S&T, he brings deep technical expertise in web development, SEO, and automation. Before acquiring Robben Media in 2023, Jeremy led marketing and branch management in the mortgage industry. He believes marketing should be measured by revenue generated, not impressions reported.